Visualizing replay results
Visualizing replay results
ReplayBG provides the possibility, to visualize in a painless way the results of rbg.replay().
This is done using the Visualizer class importable from py_replay_bg.visualizer.
In the following, we show how to do that in the case of single portions of data and portions of data spanning more than one day (i.e., intervals).
Visualizing replay results from single portions of data
To visualize replay results from single portions of data use the Visualizer.plot_replay_results() static method, which is formerly defined as:
    @staticmethod
    def plot_replay_results(
            replay_results: Dict,
            data: pd.DataFrame = None,
            title: str = '',
    ) -> None
Input parameters
replay_results: the dictionary returned by or saved with therbg.replay()methoddata, optional, default:None: Thedataparameter passed torbg.replay(). If present, the method will also compare the glucose fit vs the data.title, optional, default:None: A string with an optional title to be added to the figure.
Example
# Load previously saved results, e.g., ...
with open(os.path.join(results_folder_location, 'results', 'workspaces', 'results.pkl'), 'rb') as file:
    replay_results = pickle.load(file)

# Analyze them
Visualizer.plot_replay_results(replay_results=replay_results)
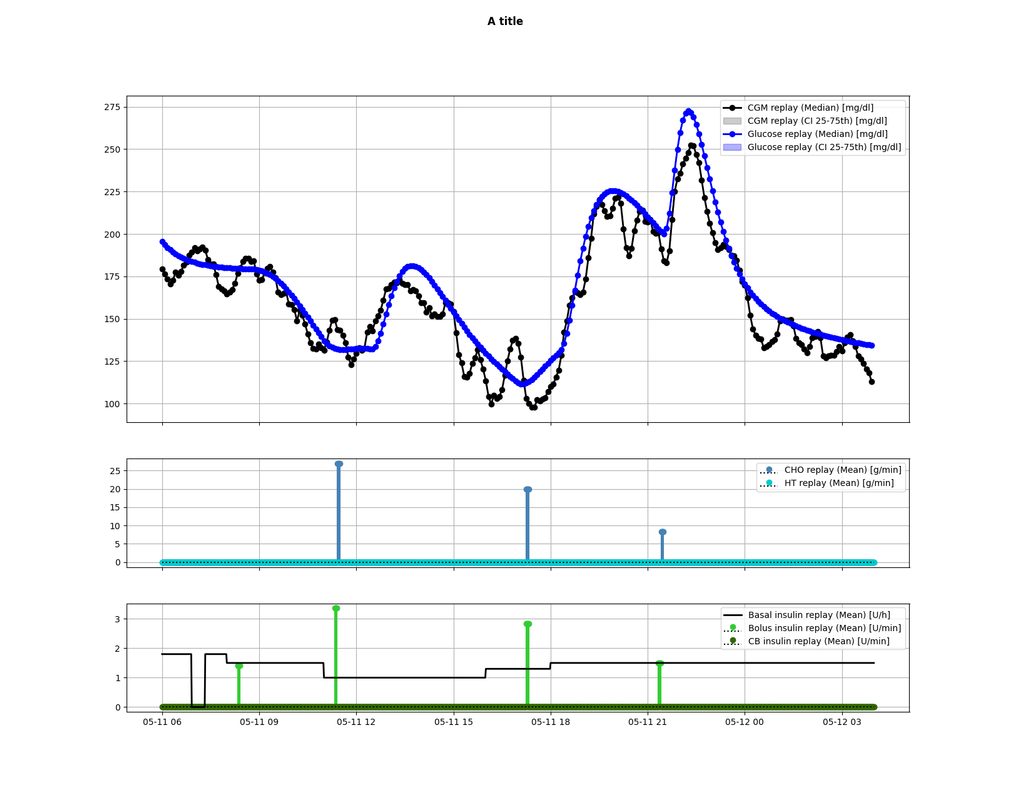
Will produce:

The full code can be found in /example/code/analysis_example.py.
Visualizing replay results from portions of data spanning more than one day (i.e., intervals)
To visualize replay results from single portions of data use the Visualizer.plot_replay_results_interval() static method, which is formerly defined as:
    @staticmethod
    def plot_replay_results_interval(
            replay_results_interval: list,
            data_interval: list = None,
    ) -> Dict
Input parameters
replay_results_interval: a list of dictionaries returned by or saved with therbg.replay()methoddata_interval, optional, default:None: The list ofdatapassed torbg.replay(). If present, the method will also compare the glucose fit vs the data.title, optional, default:None: A string with an optional title to be added to the figure.
Example
# Initialize results list
replay_results_interval = []

# Load previously saved results, e.g., ...
for day in range(start_day, end_day+1):
    with open(os.path.join(results_folder_location, 'results', 'workspaces', 'results_' + str(day) + '.pkl'), 'rb') as file:
        replay_results = pickle.load(file)
    replay_results_interval.append(replay_results)

# Visualize them
Visualizer.plot_replay_results_interval(replay_results_interval=replay_results_interval)
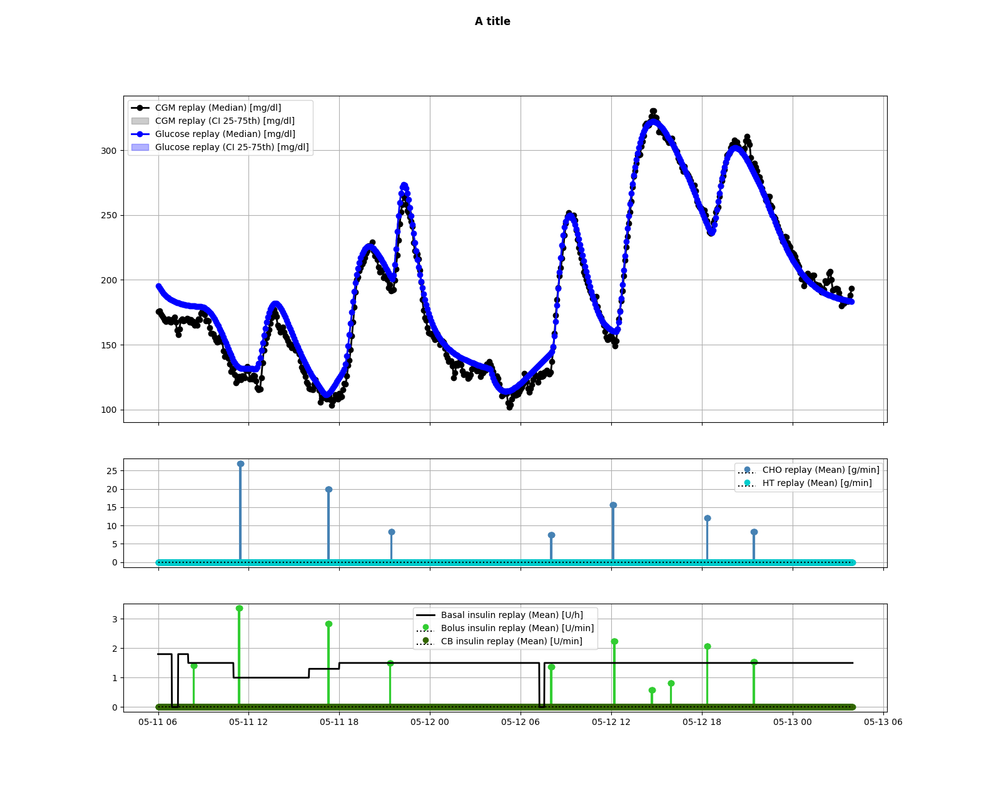
Will produce:

The full code can be found in /example/code/analysis_example_intervals.py.
